Designing for 90 Seconds: Property Intelligence UX for Insurance Underwriters

Betterview (now Nearmap) · 2021–2024

My biggest challenge at Betterview wasn't learning the design tools — it was developing domain expertise in insurance underwriting fast enough to contribute meaningfully to a highly specialized product. I built that knowledge through an executive summit in my first week, ongoing underwriter roundtables, and one-on-one interviews with end users. That understanding shaped every design decision across three years of feature development.
At my first summit — 30+ insurance carrier executives — a single requirement emerged that defined the next phase of our work: underwriters needed to complete a full roof assessment in 90 seconds.
The Problem · Hidden Data & Lost Users
Critical risk scores were buried under third-party partner tabs. Underwriters were leaving our product mid-task to find the context they needed somewhere else, and every trip away cost time against the 90-second target.
Where underwriters went instead
Yelp
Neighborhood context
Zillow
Property visuals
Google Maps
Property visuals
Solution 1 · Bring the Hidden Data Forward
We redesigned the landing page to surface primary risk indicators immediately, instead of leaving them behind partner tabs.
Company admins gained the ability to customize the data hierarchy by region and risk type, so each carrier saw what mattered most to its underwriters first.
We integrated street view and real estate imagery directly into the report, so underwriters no longer needed to leave the product to see a property.

Solution 2 · The Changes Panel
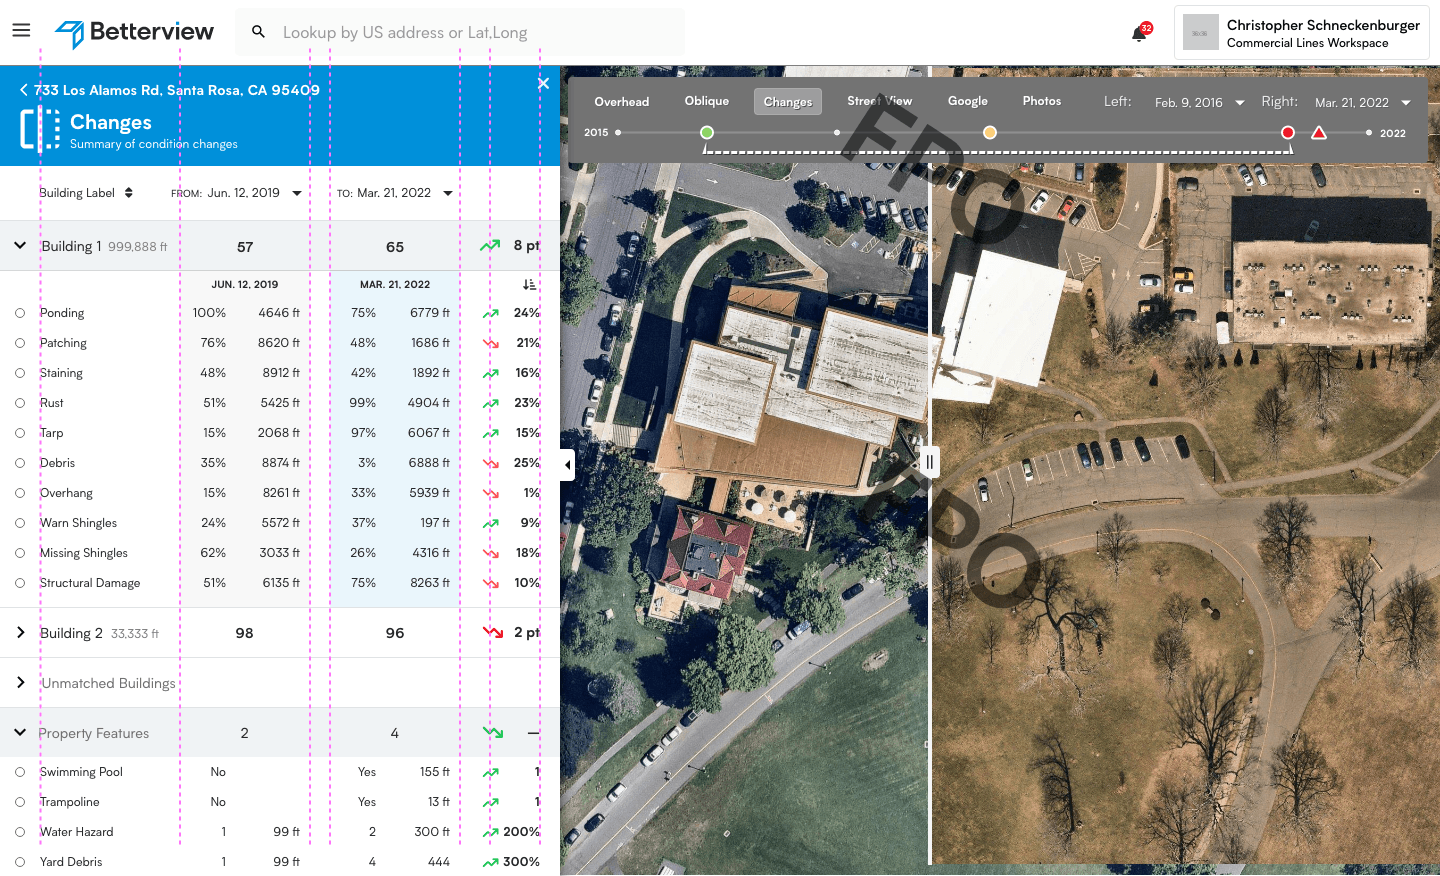
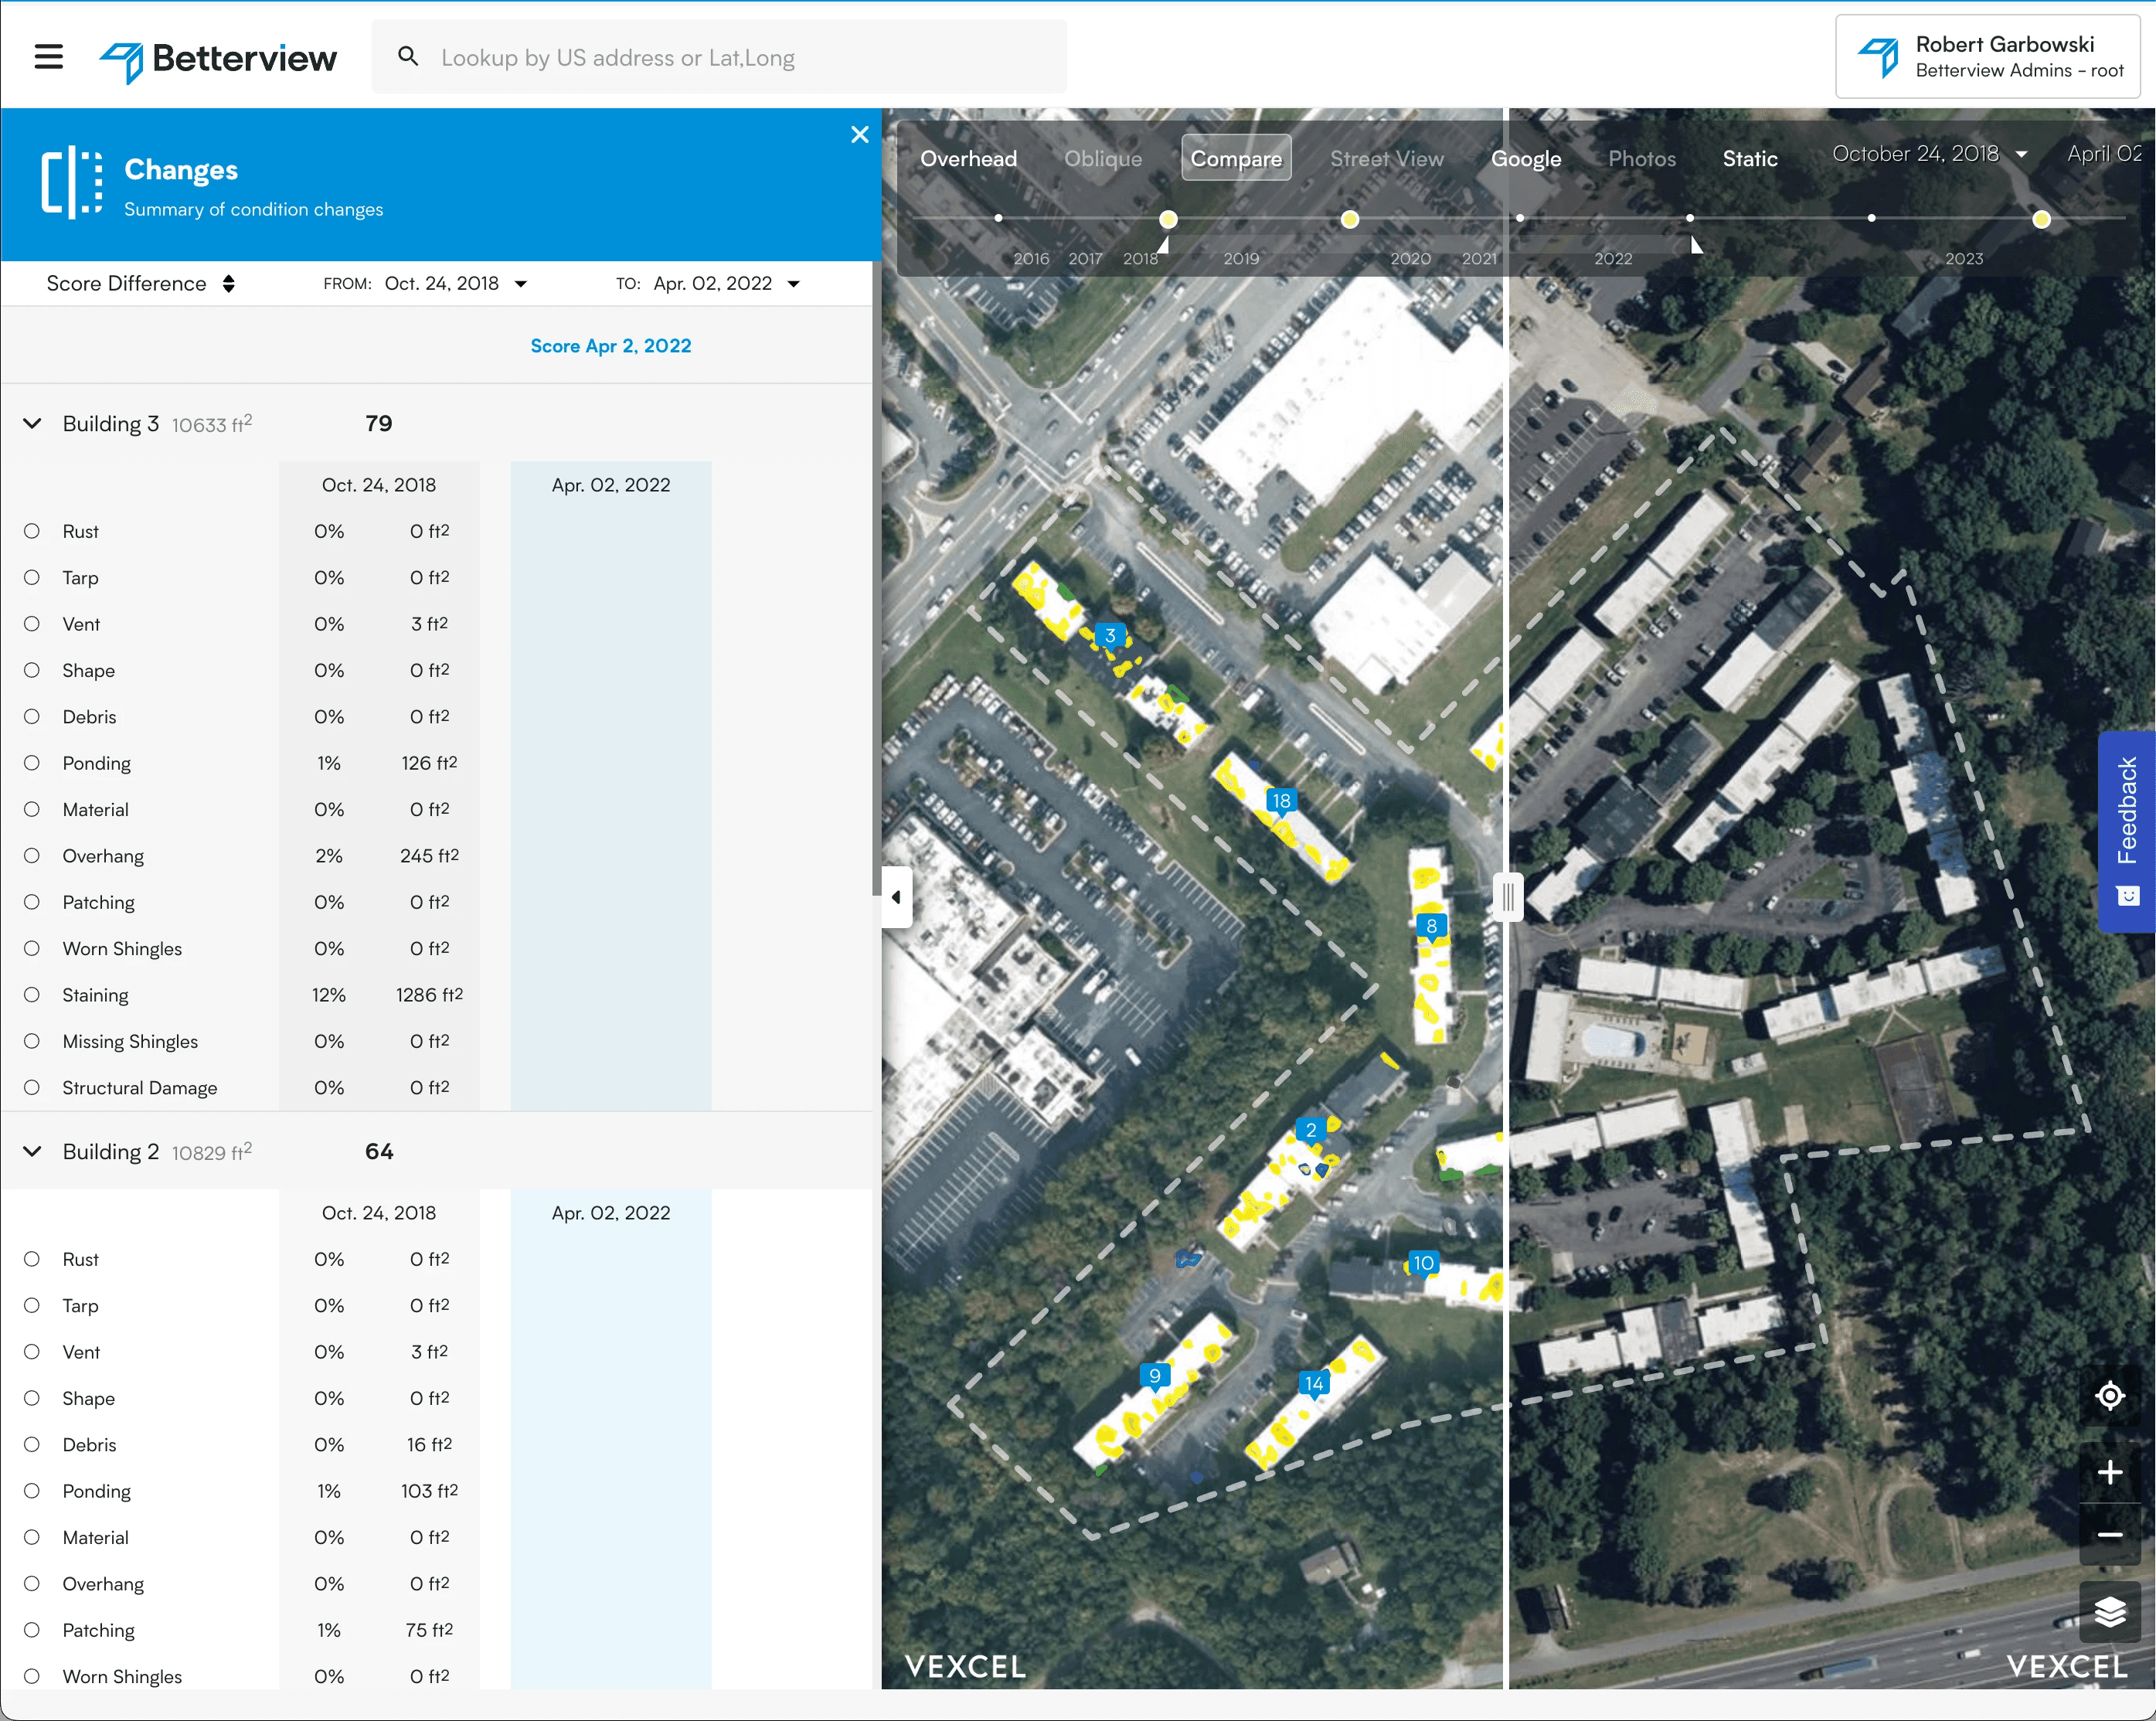
I owned design and delivery of the Changes panel — a temporal comparison view that lets underwriters see exactly how a property's condition has changed between any two imagery dates. A split-screen aerial view with a scrubable timeline sits alongside a structured table showing detection-by-detection deltas: percentage change, square footage, and change direction for every condition type across every building. This turned historical imagery from a passive reference into an active risk signal.

The Result · Validated with Data
Assessment times dropped to as low as 45 seconds, well under the 90-second target. Users stopped leaving the product.
We didn’t have to guess. I measured those times with Heap, the product analytics platform I had proposed and brought into the company. Read the initiative →
Target → Achieved
90s → 45s
Fastest measured assessments